Okapi Logistics
Warehouse efficiency is not just about moving more cartons per hour. It is about getting the right item to the right place with fewer delays, errors, and unnecessary steps. In 2026, that challenge is shaped by changing order volumes, tighter delivery expectations, labor availability, and new warehouse technology. A delayed replenishment, a misplaced pallet, or a congested packing bench can affect an entire shift.
How To Improve Warehouse Efficiency And Productivity starts with understanding how work actually flows. Track practical measures such as order accuracy, picking time, inventory discrepancies, and dock-to-stock time. Then compare the numbers with what employees see on the floor. A dashboard may show a slow picking zone; a worker may explain that labels are hard to read or fast-moving items are stored too far away. Both perspectives matter. Small changes, such as clearer location labels or better slotting, can make daily tasks easier without a costly redesign.
Technology can help, but it is not a cure-all. Warehouse management systems, barcode scanning, and automation may reduce repetitive work when they fit existing processes and are introduced with adequate training. Poor data or confusing procedures can undermine even capable tools. That part is often underestimated. This guide explores actionable ways to improve layout, inventory control, workforce planning, and technology use, while highlighting the trade-offs leaders should assess. Results vary by facility, so test changes on a manageable scale, review the evidence, and adjust when the expected gains do not appear.
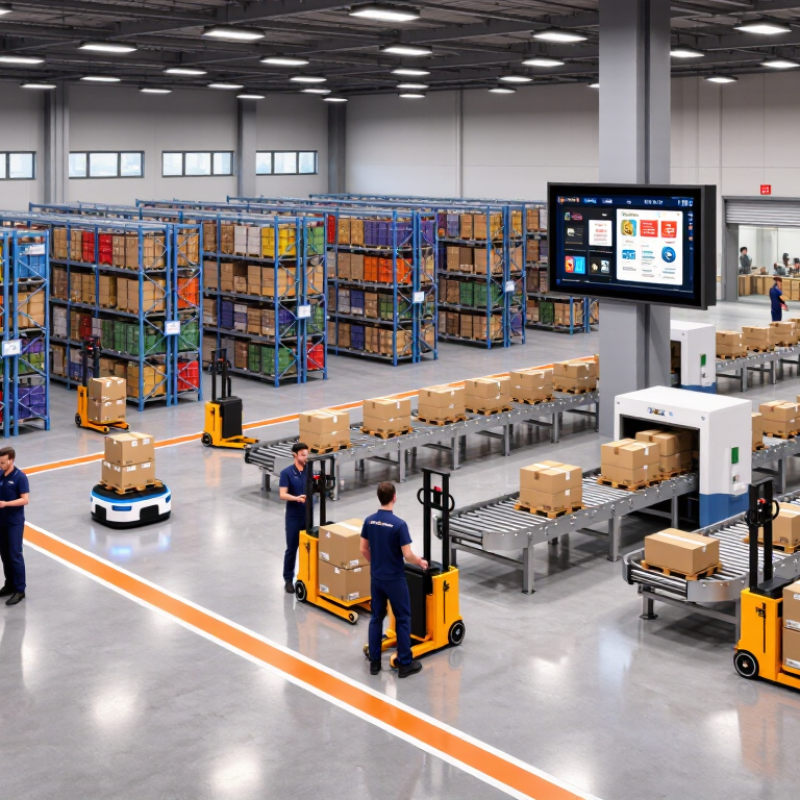
How to Improve Warehouse Efficiency and Productivity in 2026?
Benchmark Throughput, Accuracy and Labor Before Changing Warehouse Processes
Before changing a warehouse process, record its current performance. Measure orders or lines completed per labor hour, picking accuracy, and labor hours by shift and zone. Include order size and product mix; otherwise, a busy shift may look more productive simply because its orders were easier. Keep the measurement period consistent. Small details matter.
WERC’s DC Measures report provides a framework for comparing distribution-center performance, while internal data shows where a site differs from broader benchmarks. The 2024 MHI Annual Industry Report found that 55% of surveyed supply-chain professionals planned to increase technology investment. That signals interest, not guaranteed returns. Compare proposed changes against your own baseline, then pilot them in one zone and track speed, errors, and labor together. Faster picking is not an improvement if mispicks rise or workers need extra rework.
Tips: Log exceptions, overtime, and replenishment delays alongside headline rates. Review results by shift, not just by week. Ask workers what the numbers miss; a scan-time delay or awkward shelf height can distort the picture. Then adjust one factor at a time. It can feel slower at first. That is worth examining.
Illustrative warehouse baseline: The figures below are realistic example values for a general, single-shift distribution operation—not published industry averages or guaranteed targets. Record comparable site data before making process changes, then set targets based on order mix, facility layout, service requirements, and labor practices.
| Performance Dimension | KPI | Unit | Example Baseline | Example 2026 Improvement Target | How to Measure | Process Area to Review |
|---|---|---|---|---|---|---|
| Throughput | Order lines picked | Lines per direct labor hour | 105 | 115–125, with order mix held comparable | Completed order lines ÷ direct picking hours; report by shift and picking method. | Slotting, travel distance, replenishment timing, and pick-path design. |
| Throughput | Orders shipped | Orders per shift | 1,800 | 1,900–2,000 without increasing late or incorrect shipments | Count orders confirmed as shipped during the shift; separate standard and expedited orders. | Wave release, order batching, packing capacity, and carrier cut-off coordination. |
| Receiving | Dock-to-stock time | Hours from receipt to available inventory | 8.0 hours | 6.0–7.0 hours, where receiving volume and checks are comparable | Measure elapsed time from receipt scan to inventory becoming available for allocation. | Appointment scheduling, receipt documentation, inspection queues, and put-away. |
| Accuracy | Order-picking accuracy | Correct order lines ÷ total lines checked | 98.5% | At least 99.0%, while tracking error severity | Use quality checks, customer claims, and verified short-ship or mis-pick records. | Location labeling, scan compliance, item identification, and exception handling. |
| Accuracy | Inventory record accuracy | Accurate counted locations ÷ locations counted | 96.0% | At least 98.0% for routinely counted locations | Compare system quantity with physical count; report by SKU, location, and count class. | Transaction discipline, cycle-count frequency, adjustment controls, and replenishment. |
| Service | On-time, in-full shipment rate | Orders shipped on time and complete ÷ orders due | 94.0% | 96.0–98.0%, subject to supplier availability and carrier performance | Use the agreed ship-time promise and order-completeness rules; record exclusions consistently. | Inventory availability, order release timing, backorder management, and dispatch planning. |
| Labor | Direct labor productivity | Standard work units per paid direct labor hour | 100 index points | 105–110 index points, adjusted for task and order complexity | Set a consistent baseline index from completed work units divided by paid direct hours. | Work allocation, avoidable waiting, cross-training, and balanced staffing by function. |
| Labor | Overtime share | Overtime hours ÷ total direct labor hours | 8.0% | 5.0–7.0% without reducing service levels or creating unsafe work pace | Review time records weekly and compare overtime with volume, backlog, and absence levels. | Shift planning, workload smoothing, attendance coverage, and peak-period preparation. |
| Space and flow | Pick-face replenishment stockouts | Stockout events per 1,000 order lines | 12 | Fewer than 8, while monitoring replenishment labor and reserve availability | Count pick interruptions caused by empty forward locations; normalize by lines processed. | Replenishment triggers, forward-pick capacity, reserve location accuracy, and task priority. |
| Safety | Recordable injury frequency | Recordable cases per 200,000 hours worked | 3.0 | Improve against the site baseline; do not trade safety for higher throughput | Apply the applicable local reporting definition and review hours worked and case classifications. | Ergonomics, equipment-pedestrian separation, training, and near-miss follow-up. |
Benchmarking note: Compare like-for-like periods and account for SKU profile, order size, returns, automation, shift length, and seasonal volume. Establish a baseline over several representative weeks, validate data definitions with warehouse teams, and change one major process at a time so that productivity, accuracy, service, labor, and safety effects can be evaluated together.
A 2023 study found that 77% of warehouse decision-makers planned technology investment by 2028. Another industry report found 55% of supply-chain respondents planned to increase investment. Plans do not guarantee better output.
Measure a clear bottleneck, such as picking time, inventory mismatches, or missed shipping cutoffs. Test one aisle first. Keep scope small.
Repeated tasks, including carton scanning, replenishment alerts, and pallet movement, may benefit. Choose work that causes real delays, not work that merely looks modern.
Compare picks per labor hour, accuracy, travel time, stockouts, and labor hours before and after. A faster process can still create more mistakes.
Keep walkways clear, mark floors visibly, and inspect equipment before each shift. Separate pedestrian routes from forklift paths where possible. Simple, but easy to neglect.
Track completed orders, picking accuracy, replenishment delays, and on-time fulfillment. Note short picks, mislabels, and packing-station queues. Numbers need context.
Ask operators about awkward handoffs and confusing routes during shift huddles. Their observations can reveal problems a dashboard misses. That matters.
A system may shift congestion to another aisle or add exception handling. Review service and safety before expanding. Some pilots will disappoint, and that is useful evidence.
How To Improve Warehouse Efficiency And Productivity begins with understanding current performance. Before changing workflows, measure throughput, inventory and picking accuracy, labor use, error rates, and on-time fulfillment. These baseline figures reveal where delays and waste occur and make it possible to evaluate whether improvements are working. Re-slot fast-moving items in accessible locations, organize storage around order patterns, and simplify pick paths to reduce unnecessary travel and handling.
Warehouse technology and automation can further support consistent, efficient operations when selected to address specific needs. Survey trends indicate that 77% of organizations plan to invest in warehouse technology by 2028, while 55% of leaders report increasing technology investment. Introduce tools in stages, train employees, and monitor their effect on daily work. Pair productivity goals with safety measures, and regularly track output, errors, and fulfillment timeliness. This balanced approach helps warehouses improve performance without sacrificing accuracy or worker well-being.